Dave Wall is Citizen Science Officer at the National Biodiversity Data Centre in Ireland. We have had the pleasure to talk to him about the work of the organisation on trend analysis and biodiversity monitoring for climate change and about the citizen science projects he manages.
Can you tell us about the work of the National Biodiversity Data Centre and some of the projects you run?
The National Biodiversity Data Centre was established in 2007. The role of the Data Centre is to collect and collate biodiversity data from any and all sources – one data stream being citizen science projects. The Data Centre has a citizen science portal on the website where we collect data mainly through the use of dedicated online forms for various surveys. In some projects the Data Centre works in collaboration with external groups and some projects are more inhouse and have been running for a long time. The other data stream is external, which might come from academics, consultancies or government agencies. External data come to the Data Centre as bulk data sets, e.g. a national seal survey of Ireland. The National Biodiversity Data Centrecollects, collates, maps and stores data and so creates a national biodiversity data set for Ireland. We provide a one-stop-shop for biodiversity data for Ireland, e.g. offering the possibility to look up all records for a single species, from all the datasets available presented in a single map.
The Data Centre runs several projects that are more active on the ground such as the national pollinator plan which is focused on practical conservation and getting the public engaged in actions for pollinators. Our bumblebee and the butterfly surveys are more for monitoring than for crowdsourcing casual records.
These surveys have a network of sites that are regularly monitored year after year, allowing us to do trend analysis, which then feeds into national biodiversity monitoring indices and the national biodiversity plan. I manage two projects: Dragonfly Ireland, a project on dragonflies and damselflies in Ireland, and Explore Your Shore! focusing on Ireland’s marine biodiversity. The idea behind both these projects – which are funded by the Irish Environmental Protection Agency – is to look at those species groups as indices for climate change and water and habitat quality. Therefore, we are ultimately trying to get people to progress from casual surveying into regular monitoring of their local freshwater and marine habitats, maybe two or four times a year, allowing us to create a monitoring index.
Can you tell me more about these monitoring indices?
This was an easy win for the dragonfly project because we had a major dragonfly survey in Ireland 20 years ago that serves as a baseline dataset against which we can compare the data from today and see if the species has spread across the country.
We can see a very clear impact of climate change: species ranges are spreading north-west across the country for some dragonflies and some damselfly species are showing earlier flight periods – they are emerging earlier or emerging in greater numbers earlier in the year. This is a good index of how things have changed compared to 20 years ago.
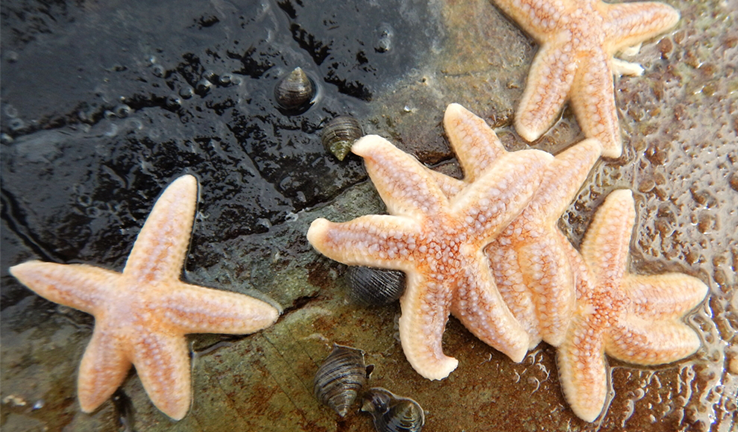
As for marine biodiversity data we do not have as good a baseline with many data gaps for marine species. That might be because there are so many marine species and most people are unfamiliar with most of the species. But we are trying to build a baseline dataset for intertidal species that we can monitor as time goes on. However, we are already seeing some good candidates there for monitoring climate change.
What exciting findings and trends have you observed in your projects?
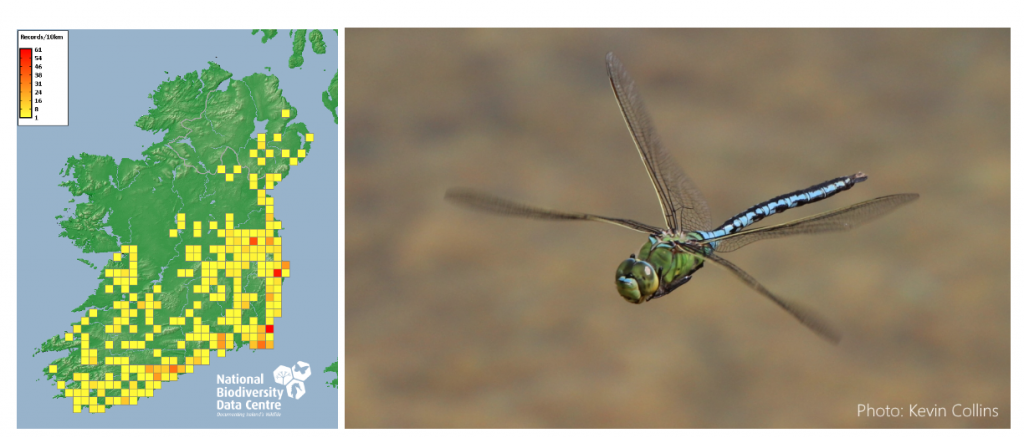
In the dragonfly project we have this big baseline dataset from 20 years ago. So we have dragonfly species that back in 2000, when the last survey was done, were just appearing on the south coast of Ireland. They had been first recorded during that survey. These are species such as the emperor dragonfly, which is found from South Africa all the way up to Finland, but that had only just arrived in Ireland in 2000. Today, this species is found as far northeast as Belfast and as far northwest as Galway. They are advancing northwestwards across Ireland year on year. We can see the range expansion but it is when you compare this to 20 years ago that is really impressive.
Quite often people struggle to understand what climate change looks like because it is a gradual thing. But this is a good way of showing them what can happen in a lifetime or less in terms of species distribution. We are able to show them graphs of flight periods for damselflies and how they have shifted earlier in the year. That is another good, clear visualisation.
This sounds exciting! Could you provide another example of species monitoring as a climate change indicator?
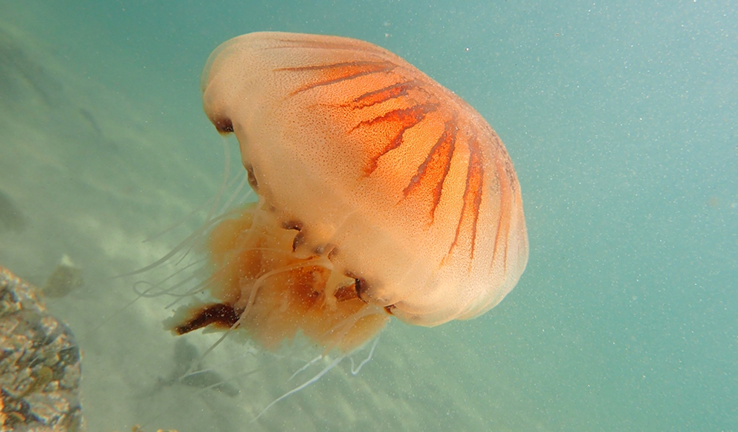
On the marine side of things for example, many jellyfish have a peak month when they are recorded so you will get 90% of the sightings in July. There is good potential for climate change monitoring: Will that peak shift with time?
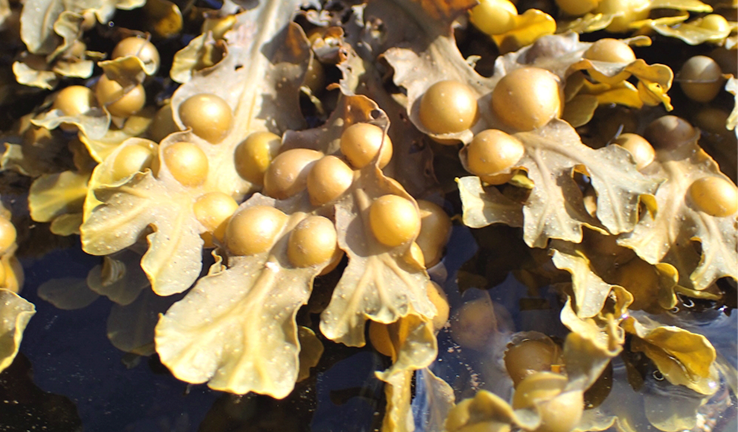
We also have a seaweed species called egg wrack that has bright gold reproductive bodies that are very noticeable on the shore where most of the things are green. This species appears in spring and they are really finely tuned to water temperature. So there is another really good candidate as a climate change indicator.
How do volunteers or recorders benefit from engaging with your projects?
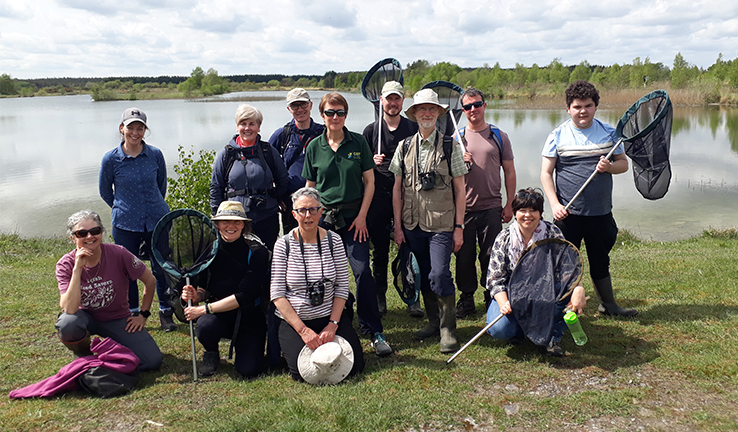
There is a whole mix of reasons as to why anyone records or gets involved in citizen science, and what actually motivates people is highly variable. However, as a recorder, I would look for the following: When I submit a record, I want to be sure that my record has been received, receive some form of acknowledgement, and be confident that that data is going to be used for something. What the recorders receive in terms of the National Biodiversity Data Centre is opportunities for training. We have a workshop programme we run every year and are getting more and more into online training: we just recently launched a course on marine biodiversity citizen science that people can go and complete at their own pace. This will give them a good grounding in the basics of intertidal recording.
Another benefit for recorders is that they can essentially create their own database. The Data Centre’s citizen science portal offers recorders a suite of tools so that they can explore their own data and compare it to the wider dataset. On the portal, the unique identifier for a recorder is their email address. So if a recorder submits all their records under a single email address they create their own database. They can then view all the records they have ever recorded, compare this year to last year, map their records, do some graphing and analysis of their own data and see whether things are increasing or decreasing or whether they are missing any species this year that they recorded last year. They can even look at what other people are recording and check county recording lists to see how they rank at the county level.
We also give feedback to recorders through newsletters a couple of times a year to update them on progress on the number of records we have, what the distribution is looking like, any interesting records and any examples where we have used the data to prepare records.
The data collected by recorders is obviously used nationally in the case of the National Biodiversity Data Centre. Do you feed it somewhere else so that it can be used at a higher level?
The Data Centre is the Irish hub for GBIF, the Global Biodiversity Information Facility. So the data we collect goes to GBIF, which is global. We also contribute marine data to EUROBIS, the European Ocean Biodiversity Information System, so our data feeds into the European database there.
There are a lot of different platforms out there. To try not to create multiple duplicates of the same data we try to share it out to the major hubs. In the case of GBIF, this is all automated. Once the data goes into our databases they are shared straight to GBIF within fairly short time periods.
How might some of Cos4Cloud’s tools and services support your projects or the work of the Data Centre?
One of the challenges as a national data centre is validation. As we grow, we receive more and more records each year. All those records need to be validated. So if that grows exponentially it becomes a challenge. Here is where crowdsource validation and AI validation would really offer the huge advantage of being able to validate the common, easily recognisable, species. We would still have to probably get expert validation of the rarer and more tricky species but it could reduce the bulk of the validation burden down to something more manageable.
In terms of data validation, we would certainly have interest in Pl@ntNet-API and AI-taxonomist. Generally speaking, any tools that can make validation better and that can make recording more sleek would always be potentially interesting.
At the Data Centre we prepare distribution maps, available on our website, where you can figure out whether a species is likely to be in your area or not. What it does not enable is for you to enter that you are in a certain place and then map all the species that you are likely to find there, although you can download a spreadsheet of all species located within a particular area. There is potential interest in tools that enable this and could be integrated into our app, similar to AI-GeoSpecies.
What do you think the future of citizen science looks like?
The important thing is that we need a balance. We need to allow recorders to continue to enjoy recording and not take the fun away by turning it into some tech-only activity or some burden of technological wizardry where you have to carry around six bits of equipment and deploy things, change battery packs, etc. Some people like to wander around with a butterfly net and do it the traditional way. There needs to be a balance between that kind of recording and using technology to generate bigger and bigger datasets that then need to be validated. And so I think the future will be pretty much the same kind of stuff, except maybe sleeker on the data management front. That is what I would like to see. Let’s face it: citizen science requires citizens. So if you exclude the citizens through technology, then you are not doing your job. The other really important thing is to make the feedback to recorders as smooth as possible and offer them more options as to what they can do with their data and how they can learn from identification errors.
To get involved with biodiversity monitoring in Ireland, visit the website of the National Biodiversity Data Centre.
To learn more about Cos4Cloud services for citizen science, visit the project’s services description.