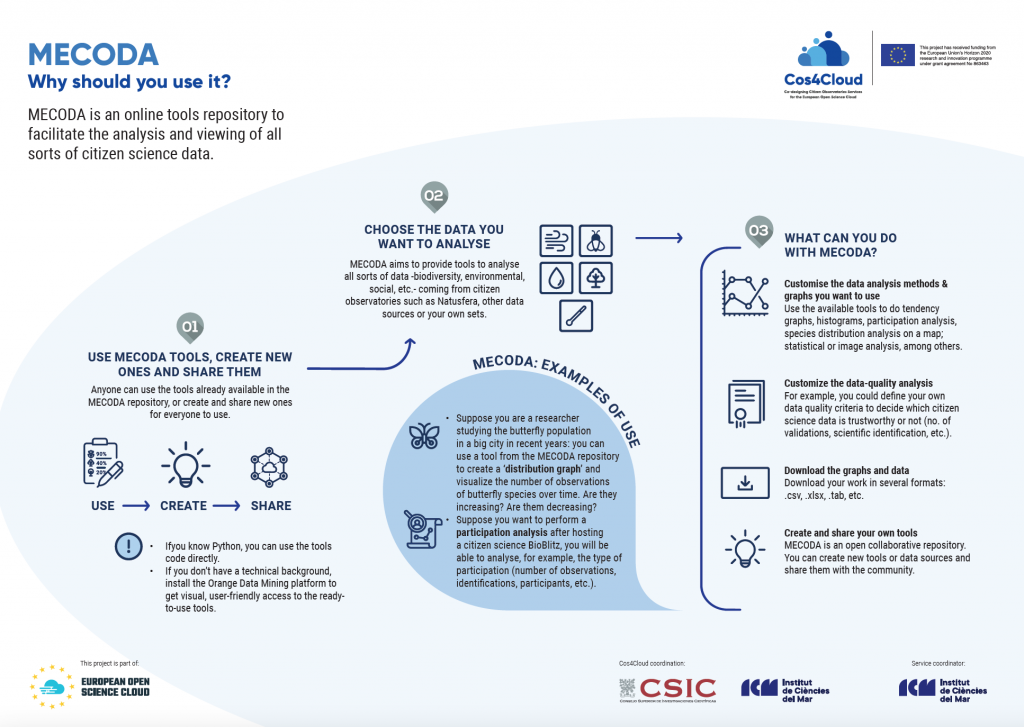
MECODA (ModulE for Citizen Observatory Data Analysis) is an online tools repository to facilitate the analysis and viewing of all sorts of citizen science data.
Service description:
MECODA is a repository to facilitate analysing and viewing all sorts of citizen science data. This service aims to break the barrier between experienced users or programmers and the general public. It allows users from citizen observatories to make their own exploratory visual data analysis without the help of specialised analysts. It also enables observers to create their own reproducible visual dataflows and share and reuse them.
Development & functioning :
MECODA is based on Orange Data Mining, a visual programming toolbox made to simplify analysis and data visualization. Orange supports the construction of data analysis workflows by assembling components for data preprocessing, visualization, and modeling. MECODA has developed specific widgets to access data from citizen observatories. At present MECODA allows access to data from Minka, OdourCollect, CanAirIO or Ictio, but it can be expanded easily to other observatories and different citizen science data types.
- User-friendly access to various citizen science observatories
- Customizable data-quality control
- Customizable data-analysis methods
- Data-viewing tools that are commonly used in the oceanographic community
- Exports data in different tabular formats. It also offers the ossibility to export images locally and the workflows can be saved and reproduced
MECODA is aimed at scientists, students, citizens, and anyone doing research and training activities associated with citizen science and citizen observatories.
Innovation for citizen observatories:
- MECODA develops a visual programming approach to access real-time data from the citizen science observatories included in the platform. How? Each widget makes the necessary requests to the API, gets the data in a structured way and shows a data table as output. This table can be assembled with other Orange prebuilt widgets created to allow from simple processing or visualization to complex explorations. Using different tools of MECODA, it is easy to develop geospatial analysis, statistical approaches or image analytics processes. The result is a workflow that can be saved and reproduced by others, modified when necessary. The images and data can also be saved locally for further exploration. Users don't need a technical background to use MECODA.
Keywords:
Python, Jupyter, data analysis, data quality, data visualization.
Relevant links & guidelines:
Coordinator:


